“Equivalent to x Three Gorges Dams”
In 2010, Shi Dinghuan, then counselor of the State Council, gave an optimistic prospect for China’s solar power:
“In 10 years, the total amount of solar power generated in China will be equivalent to about 1.5 Three Gorges Dams … China will make significant adjustments to its solar power targets by the year 2020. The capacity for solar power… will reach 20 to 30 GW. This implies a more than tenfold increase compared to the previous target.”
At the time, Shi thought it was a long shot to raise the installed capacity of solar power on par with the Three Gorges Dam, expected to reach 18 GW in 2017. As it turned out, the installed capacity of solar power in 2020 surpassed significantly, reaching 250 GW. The Three Gorges Dam is still the largest power station in terms of installed capacity, but it has already become an example for Chinese media to puff up the country’s impressive achievements in solar power. As told by a report on People’s Daily in November 2023:
“The installed capacity of our country’s domestic distributed solar has surpassed 100 GW, reaching 105 GW… equivalent to the total installed capacity of more than 4 Three Gorges Dams”.
In another story in May 2024, it repeated:
“The national installed capacity has surpassed 3 billion kilowatts, reaching approximately 3.01 billion kilowatts… equivalent to the total installed capacity of about 133 Three Gorges Dams. Among (the national installed capacity), the installed capacity for solar power is approximately 670 GW.”
The Three Gorges Dam’s priority is flood control, but one may still feel sorry for the million residents displaced by the construction when the national media repeatedly dwarfed the dam’s energy output. Fortunately, these comparisons of “equivalent to dams” are problematic when examined closely.
The so-to-say equivalence is based on the comparison of “installed capacity” (装机容量) – the potential output of a power plant when operating at full capacity. Indicated in GW (gigawatts, meaning a million kilowatts), it is a standard metric to show the scale of power stations, as household or industrial energy consumption is measured in kWh (kilowatt-hour). For instance, see the following report by the National Energy Adminstration in 2021:
“On 30 August… all 34 units of generators operated fully while connected to the grid, producing 22.5 GW. It achieves full capacity for the first time in 2021… At full capacity, average daily power generation of the Three Gorges Dam can reach 540 million kWh (22.5 GW x 24 hours). Given an average monthly power consumption of 100 kWh for a three-person household, (the power produced by the dam in one day) can meet the monthly needs of 5.4 million households.”
As quoted above, China’s latest installed capacity for solar power, reported in May 2024, is 670 GW. Keep the simplified assumption of average energy consumption for a three-person households, the power it produces in a day will accordingly be able to meet the monthly needs of over 160.8 million households. However, this is based on an unrealistic assumption that the generators can always perform at peak capacity. As the management of the Three Gorges Dam has stated, they only reach full capacity occasionally. Also, sunlight is not available in one location 24 hours a day. Therefore, a comparison solely based on installed capacity does not reflect reality.
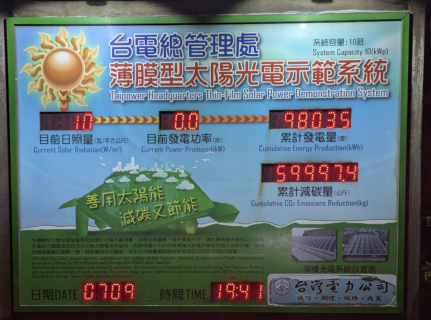
During a recent trip to Taipei, the author stayed near the Taipower Building, where a display showed the current and cumulated solar power output. This brings us to what is missing in the Chinese media discourse, namely, the capacity factor – the ratio of the actual electricity generated, for the time considered, to the energy that could potentially be generated at continuous full-power operation during the same period. A report by the Atlantic Council, an American think tank, estimated that China’s solar capacity factor in 2023 stood at 14%, while known records showed that the capacity factor for the Three Gorges Dam was around 40%. Thus, when the actual energy production is considered, statements like “the installed capacity of y is equivalent to x Three Gorges Dams” make little sense, not to mention taking into account other factors such as grid, storage, diminishing returns, and equipment maintenance.
China’s achievements in renewable energy are world-leading and noteworthy. The low rate of the capacity factor for solar power may be a pushback. Still, by promoting accurate and meaningful statistics, the state can enhance public understanding and garner support for renewable energy initiatives in the future. Thus, clever propaganda would be to report the national achievements truthfully and use the opportunities to prompt better data literacy among its people. Making comparisons solely based on installed capacity is in the wrong direction; it offers, at best, a tunnel vision, if not a misleading one.
Sources:
- 中國氣象報社. “我太陽能發電目標是三峽水電站1.5倍.” 中國氣候變化信息網February 8, 2010
- 人民網. “2250萬千瓦!三峽電站34台機組今年首次滿負荷運行.” 國家能源局 September 3, 2021.
- 人民日報 . “我国户用光伏装机突破1亿千瓦.” 國家能源局 November 20, 2023.
- 人民日報. “全國累計發電裝機容量已超30億千瓦.” 國家能源局 May 31, 2024.
- Joseph Webster. “China Builds More Utility-Scale Solar as Competition with Coal Ramps Up.” Atlantic Council, May 9, 2024. Accessed July 24, 2024.
(posted by Gus Tsz-kit Chan)

